Effectiveness of a Digital Speed Displays
 Effectiveness of a Digital Speed Display Trailer on a Rural Low Volume Road
Town of Clinton, Kansas
Prepared by, Brad Ayres
Douglas County Public Works | summer 2020
Radar speed trailer provided by Kansas University Transportation Center and The Kansas Local Technical Assistance Program
Purpose
The purpose of this study was to test the effectiveness of a radar speed trailer on a low volume rural road that is subject to higher speeds due to its location and access to seasonal water sporting activities and out of town unfamiliar drivers.
Introduction
The town of Clinton, Kansas is situated on the central west portion of USACE Reservoir Clinton Lake in Douglas County, Kansas. Clinton has a population of 531 residents according to the year 2000 United States Census Bureau and coversapproximately 17.3 sq. miles of land with majority of the population residing along Douglas County Route 6 as shown on the map below.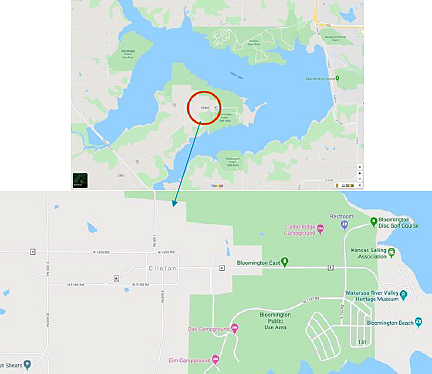
Clinton is a unique town due to the fact that there is essentially one route leading to and through the town. This route connectsmany lake activities including a Public Beach, Boat Ramps, Campgrounds and Fishing areas.
Background
Throughout the years, the residents of Clinton Town have been concerned with the amount and speed of traffic directly through their town especially during the warmer months of the year. Many attempts have been made to reduce speeds of vehicles alongthis route. Sections of the road were different speed limits at different times in the past and have recently been changed to be aconsistent 30 mph from the west city limit on east to the USACE property line. The most recent information from some of the residents is that changing the speed limits has helped very little in controlling speeds. A decision was made to test the effectiveness of a radar speed trailer in controlling speed.
Equipment Used:
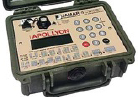
2 - JAMAR TECHNOLOGIES TRAX APOLLYON Traffic Counters/Classifiers using twin EPDM road tubes with 2 footspacing. Layout #6, 2 Lanes 2 Directions.
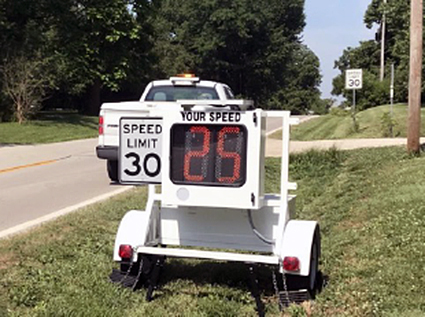
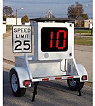
1 – MPH digital speed display radar trailer with red flashing over speed display
 |  |
Upon investigating the ideal locations for the traffic recorders and the speed trailer it was decided to collect information with the recorders at or close to the East and West end of town. The speed trailer was to be set within the town, between the trafficrecorders. This would provide the best information of speed approaching the display trailer and after passing.
To determine the effect on vehicle speed, data was collected with the traffic recorders a week prior to setting the speed trailer up.The speed trailer has the ability to only show speeds for one direction of traffic so it would need to be set for one week foreastbound and one week for westbound traffic. In concluding data collection, the recorders were left out one week after theremoval of the trailer.
Data collection began on Tuesday 6/3/2020 and concluded on 6/30/2020. Within that time the speed trailer was displayed from:
6/09/2020 to 6/16/2020 for Eastbound traffic - set to flash red at 31 MPH. 6/16/2020 to 6/23/2020 for Westbound traffic – set to flash red at 31 mph.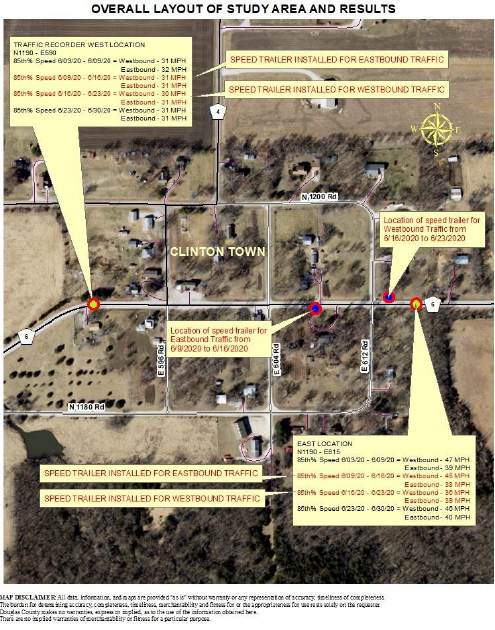 The speeds shown above are 85th % speeds in Miles Per Hour.
The 85th percentile speed is defined as, “the speed at or below which 85 percent of all vehicles are observed to travel under free-flowing conditions past a monitored point.”
Summary of Results
As you can see from the map on previous page, the traffic recorders were placed at varying distances from the speed trailer on opposite ends of town. This was done so that you would be able to see any differences in speeds before, during and after thestudy for both directions. The far west recorder did not see much of a difference for the eastbound traffic due to the speed trailernot being visible until the driver was past the recorder. The hope was to see some change for the westbound traffic after passing the speed trailer. The results show a one MPH drop when the trailer was deployed for westbound traffic.
The biggest change in speeds was for the east traffic recorder for the dates of 6/16 to 6/23 for westbound traffic. The speed trailer was much closer to this recorder and as a result the changes were noticeably different. The table below is a smaller breakdown ofthe directions and the results of adding speed trailer for the particular direction.
The Traffic Recorders will be named accordingly as West Recorder and East Recorder
DATE RANGE and RECORDER | DIRECTION | Speed Trailer Deployed for Westbound Traffic | Speed TrailerDeployed forEastbound Traffic | 85th % Speed |
6/3 to 6/9 west Recorder | Westbound | no | no | 31 mph |
6/16 to 6/23 west Recorder | Westbound | yes | no | 30 mph 1 mph reduction |
6/3 to 6/9 east Recorder | Westbound | no | no | 47 mph |
6/16 to 6/23 east Recorder | Westbound | yes | no | 36 mph 11 mph reduction |
6/3 to 6/9 west Recorder | Eastbound | no | no | 32 mph |
6/9 to 6/16 west Recorder | Eastbound | no | yes | 31 mph No change |
6/3 to 6/9 east Recorder | Eastbound | no | no | 39 mph |
6/9 to 6/16 east Recorder | Eastbound | no | yes | 38 mph 1 mph reduction
|
The tables on the next few pages show the breakdown of all data collected. Note: tables have a label for both Eastbound andWestbound in upper right corner.
Before Speed Trailer Deployment - Dates 6/3 to 6/9
Note 85th % speeds
West Traffic Recorder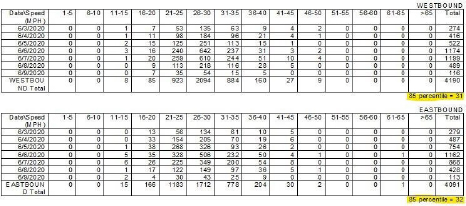
East Traffic Recorder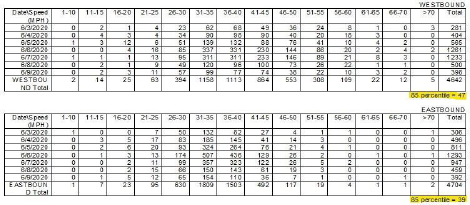
During Speed Trailer Deployment - Dates 6/9 to 6/16 for Eastbound lane only
West Traffic Recorder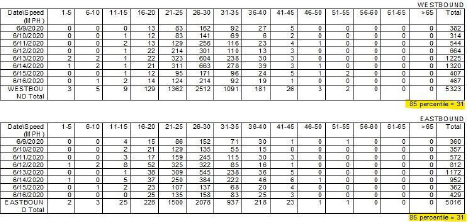
East Traffic Recorder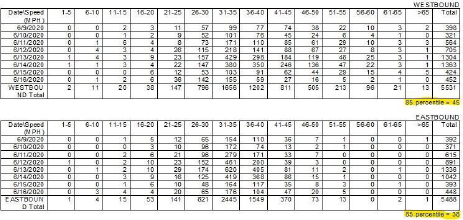
During Speed Trailer Deployment - Dates 6/16 to 6/23 for Westbound lane only
West Traffic Recorder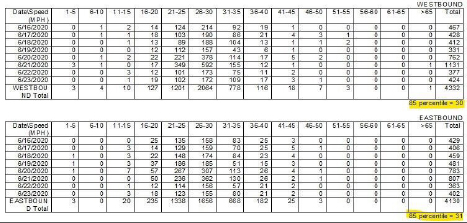
East Traffic Recorder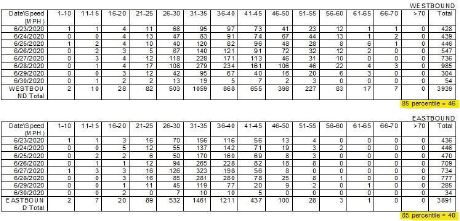
After Speed Trailer Removed - Dates 6/23 to 6/30 6/23 to 6/30
West Traffic Recorder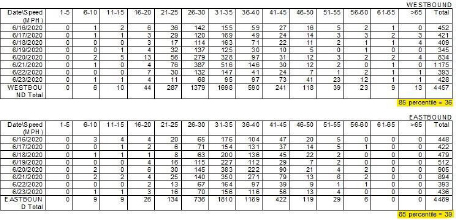
East Traffic Recorder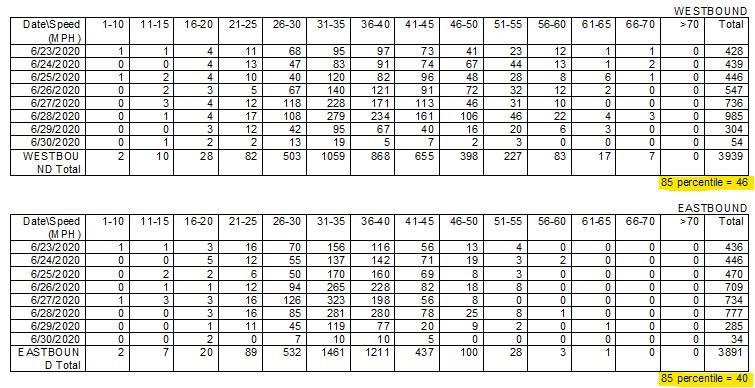
In Conclusion
The intended results of this study was initially to pinpoint speeding issues through the town of Clinton, Ks. This is why data was collected before and after the trailer was set in place. Douglas County is looking into the possible purchase of a speed trailer or something similar and this was an excellent opportunity to test the effectiveness of this type of device.
The setup of this study may not have been an ideal situation or way to deploy a radar speed trailer. I think in the future, setting up a traffic recorder right next to the speed trailer may show different results but for the outcome of the Clinton study the results were promising.
When analyzing the data, you can see that the EAST traffic recorder was most effected by the trailer deployment. Thiscould possibly be due to the recorder being placed closer to the trailer. In researching this, generally, a radar speed sign will slow traffic down somewhere from 1 mph to 11 mph compared to conditions before the sign. A study in Riverside, California, researchers observed a 6.1 mph reduction at the radar speed sign trailer and a 2.9 mph speed reduction down thestreet past the trailer. Then, one week after the speed trailer was removed, there was still a 0.6 mph reduction at the trailerand 1.7 mph reduction downstream. A study in Minnesota found slower traffic a full year after the temporary speedfeedback signs were removed. Another study found that average speeds on Pennsylvania highways increased between 3 and 9 mph the week after radar speed signs were removed. This looks to be the case in this study.
The question can be asked, is a radar speed trailer worth the cost? I would say yes, if you are planning to temporarily slow traffic for an event or maybe some temporary road construction. In the long term I do not feel that a radar trailer is apermanent solution to slow drivers due to the fact if one is installed permanently, drivers will become accustomed to the sign and its effectiveness will be lost. There was also some evidence in the data that showed on the days the trailer was inplace some drivers tried to “get a high score” and there were few speed numbers nearly off the charts.
Follow up studies may be conducted in the future for a different location.
Thank you, Brad Ayres,
Traffic Services Superintendent Douglas County Public Works